Debt facilities
Note – the figures below are updated twice a year at H1 and Year End.
| £m | £m | Maturity | |
|---|---|---|---|
| 6.5% secured bonds | 175.0 | March 2026 | |
| 1.875% green bonds | 350.0 | November 2031 | |
| 5.25% bonds | 250.0 | May 2032 | |
| 2.68% private placement notes | 55.0 | January 2026 | |
| 3.46% private placement notes | 30.0 | May 2028 | |
| 4.41% private placement notes | 25.0 | January 2029 | |
| 2.87% private placement notes | 93.0 | January 2029 | |
| 2.97% private placement notes | 50.0 | January 2031 | |
| 3.57% private placement notes | 75.0 | May 2031 | |
| 3.09% private placement notes | 52.0 | January 2034 | |
| 4.68% private placement notes | 75.0 | January 2034 | |
| Bonds and USPPs | 1,230.0 | ||
| Revolving credit facility | 100.0 | November 2027 | |
| Revolving credit facility | 450.0 | July 2029 | |
| Term loan | 82.5 | December 2027 | |
| Term loan | 82.5 | February 2028¹ | |
| Term loan | 100.0 | June 2028 | |
| Committed bank facilities | 815.0 | ||
| Total facilities | 2,045.0 |
¹Following the extension exercised in January 2026
The maturity profile of these facilities is shown graphically below:
Proforma maturity profile of debt facilities²
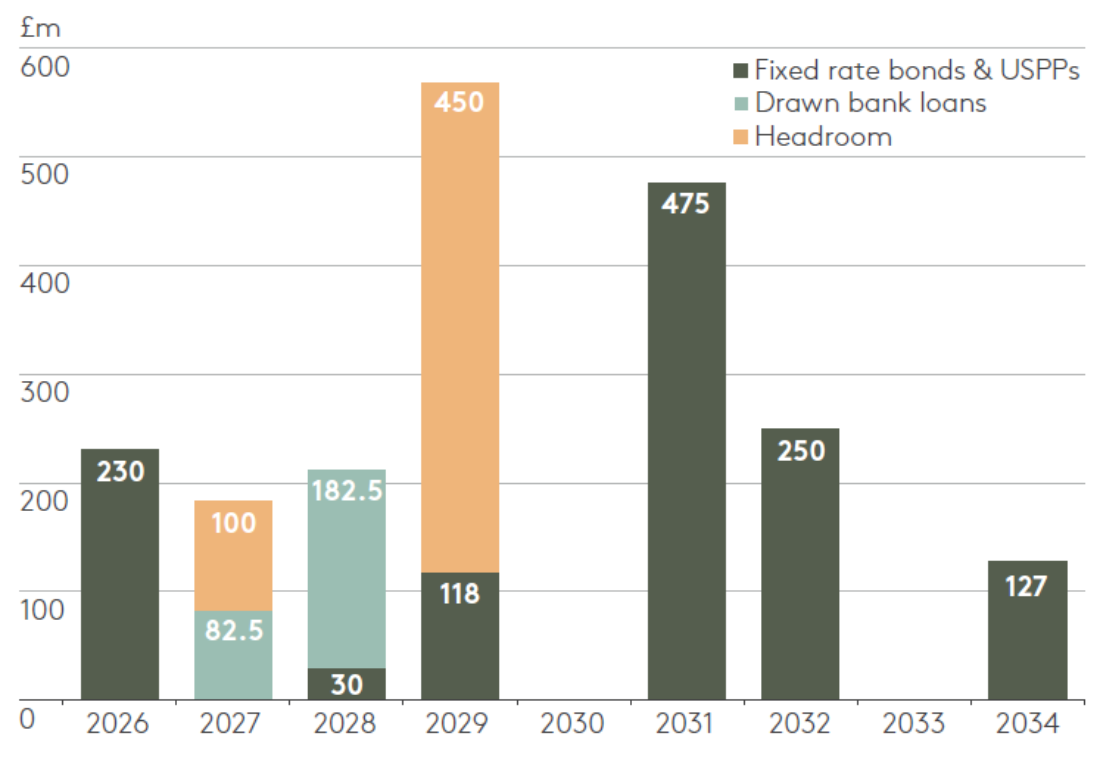
²Includes facility extension of £82.5m term loan, exercised in January 2026
Our net debt and key debt ratios are shown below:
Net debt
Dec 2025 £m | Dec 2024 £m | ||
|---|---|---|---|
| Bank facilities | 265.0 | 293.0 | |
| 6.5% secured bonds 2026 | 175.0 | 175.0 | |
| 1.5% convertible bonds 2025 | 0.0 | 175.0 | |
| 1.875% green bonds 2031 | 350.0 | 350.0 | |
| 5.25% bonds 2032 | 250.0 | 0.0 | |
| 2.68% private placement notes 2026 | 55.0 | 55.0 | |
| 3.46% private placement notes 2028 | 30.0 | 30.0 | |
| 4.41% private placement notes 2029 | 25.0 | 25.0 | |
| 2.87% private placement notes 2029 | 93.0 | 93.0 | |
| 2.97% private placement notes 2031 | 50.0 | 50.0 | |
| 3.57% private placement notes 2031 | 75.0 | 75.0 | |
| 3.09% private placement notes 2034 | 52.0 | 52.0 | |
| 4.68% private placement notes 2034 | 75.0 | 75.0 | |
| Other loans | 0.0 | 20.0 | |
| Acquired fair value of secured bonds less amortisation | 1.8 | 3.4 | |
| Equity components and unwinding of discounts on convertible bonds | 0.0 | (0.6) | |
| Unamortised discount on green bonds | (1.1) | (1.3) | |
| Unamortised discount on bonds | (1.2) | 0.0 | |
| Leasehold liabilities | 41.0 | 34.6 | |
| Unamortised issue and arrangement costs | (7.9) | (6.0) | |
| Cash at bank excluding restricted cash | (77.2) | (15.4) | |
| Net debt | 1,450.4 | 1,482.7 |
Gearing and interest cover ratio
| Dec 2025 | Dec 2024 | ||
|---|---|---|---|
| EPRA loan-to-value ratio (%) | 29.4 | 29.9 | |
| NAV gearing (%) | 40.1 | 41.9 | |
| Net interest cover ratio¹ | 3.1x | 3.9x | |
| Net debt/EBITDA | 9.0x | 9.3x |
¹ Includes share of joint ventures for the period of shared ownership
Debt summary
| Dec 2025 £m | Dec 2024 £m | |
|---|---|---|
| Bank loans | ||
| Floating rate | 265.0 | 218.0 |
| Swapped | 0.0 | 75.0 |
| 265.0 | 293.0 | |
| Non-banking debt | ||
| Fixed rate secured bonds 2026 | 175.0 | 175.0 |
| Fixed rate convertible bonds 2025 | 0.0 | 175.0 |
| Fixed rate green bonds 2031 | 350.0 | 350.0 |
| Fixed rate bonds 2031 | 250.0 | 0.0 |
| Fixed rate loan 2026 | 55.0 | 55.0 |
| Fixed rate loan 2028 | 30.0 | 30.0 |
| Fixed rate loan 2029 | 25.0 | 25.0 |
| Fixed rate loan 2029 | 93.0 | 93.0 |
| Fixed rate loan 2031 | 50.0 | 50.0 |
| Fixed rate loan 2031 | 75.0 | 75.0 |
| Fixed rate loan 2034 | 52.0 | 52.0 |
| Fixed rate loan 2034 | 75.0 | 75.0 |
| Other loans | 0.0 | 20.0 |
| 1,230.0 | 1,175.0 | |
| Total debt (nominal values) | 1,495.0 | 1,468.0 |
| Hedging profile (%) | ||
| Fixed | 82 | 80 |
| Swaps | 0 | 5 |
| Floating | 18 | 15 |
| 100 | 100 | |
| Percentage of debt that is unsecured (%) | 88.0 | 88.0 |
| Percentage of non-bank debt (%) | 82.0 | 80.0 |
| Weighted average interest rate for the year (%) | 3.8 | 3.3 |
| Weighted average interest rate (%) | 4.06 | 3.53 |
| Weighted average maturity of facilities (years) | 4.0 | 3.4 |
| Weighted average maturity of borrowings (years) | 4.2 | 4.0 |
| Unutilised facilities and cash | 627 | 487 |
| Uncharged properties | 4,754 | 4,665 |